
Problems with Taking P/E at Face Value
Terminology

Would you judge a person solely by their appearance or age? We will not! Then why judge a company by their Price to Earnings (P/E) Ratio only? I recently got to know a friend of mine who had invested a significant amount of her savings (from pocket money :) in a stock purely based on the P/E Ratio, and guess what, her portfolio is half wiped out (don’t worry, the details are there in this article, I promise, so keep reading).
You know, when I asked her why she judged the stock based on P/E Ratio only, she answered “Everyone on YouTube is talking about it like it is gospel, and moreover, it was lower than the other companies, who doesn’t love a discount?” Honestly, I burst out laughing after all, it is a true and basic human psychology! Whether it is gadgets, clothes or stocks, if it is cheap, it feels like a great deal.
But here is the thing, just like not all 50% discount guarantees a good product, not all low P/E ratio means a good investment, and sometimes it is cheap for a reason! It can be a trap, too, that wipes out your capital. In this article, we will break down the concept of P/E and see what it tells us, where it can mislead us, and the reason we should see the behind-the-scenes story to understand the figures, and may come across some cases where high P/E is justified and when a low one is screaming to RUN!
What is Price to Earnings (P/E) Ratio?
Let us first understand what the P/E Ratio is based on its formula.
The formula of P/E Ratio = Market Price Per Share / Earnings Per Share
Earnings Per Share = Profit after Tax / Number of Shares
Formulas are always intimidating, aren’t they? So, to simplify the formula in plain English, it means the number of times I am, or the market is willing to pay, for one rupee of earnings. Suppose after computing, the P/E of a stock comes out to be 20, it means that for every rupee the company is earning, people are ready to pay 20 times more.
Now, theoretically, it is said:
A high P/E Ratio means the stock is overvalued and is costly, as people are expecting more from the company.
While a low P/E Ratio stock is viewed as undervalued or cheap, as people are expecting less from the stock at the moment, or it is not yet on the radar of investors.
Now here is the trap: P/E Ratio is not valuation! It is just a reflection of the market’s belief about the stock’s valuation.
Pick The Better Stock
Let us take a few companies, compare their P/E ratios, and see whether those ratios reflect their true picture.
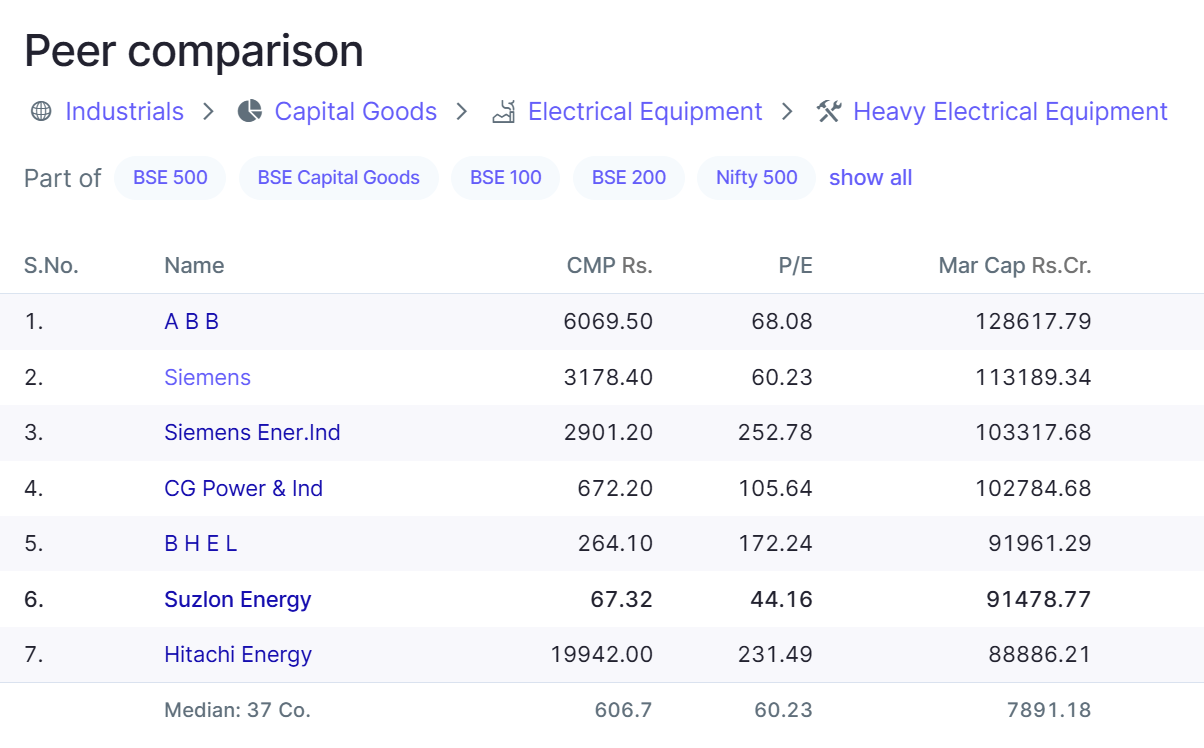
This is the list of companies that fall under heavy electrical equipment in the power generation industry. Now, if you have a glance at their P/E Ratios, you will notice something peculiar. It ranges from 44.16 to a whopping 252.78. So, if we are following our good old textbook knowledge (Low P/E Ratio = Undervalued = Better Buy), then Suzlon Energy should be the undervalued gem of the lot.
Wrong, absolutely wrong and dangerous!
Suzlon Energy
Suzlon may look cheap on paper, but a lot is going on behind.
Suzlon has been under massive debt stress in the past and has only recently been able to reduce it.
Earnings are extremely volatile and have very recently turned positive after years of financial turbulence.
It operates under a capital-heavy and policy-dependent segment (renewable wind energy).
Of course, it is slowly trying to walk again after years of injury, but we are definitely not going to bet our retirement money on it yet, and that is why P/E is lower. The market is not rewarding it due to its extremely high risk profile, but we do hope it succeeds!
Hitachi Energy
Now let us talk about that one company which enters, and investors are ready with open wallets in their hands, even though it is trading at ₹19,942 as of 28th June 2025. Hitachi Energy has turned out to be a multibagger stock, due to its extreme growth potential as described by analysts.
Many of their product lines are working at 70% capacity.
Compared to other peers, their execution of their plans has been faster.
There has been a constant growth in sales and margins.
The company is planning for a ₹2000Cr CAPEX to increase its installed capacity.
Domestic and global demands for their products are rising.
Cyclical Business
The chart below, which looks weird, is of Tata Steel's P/E ratio.
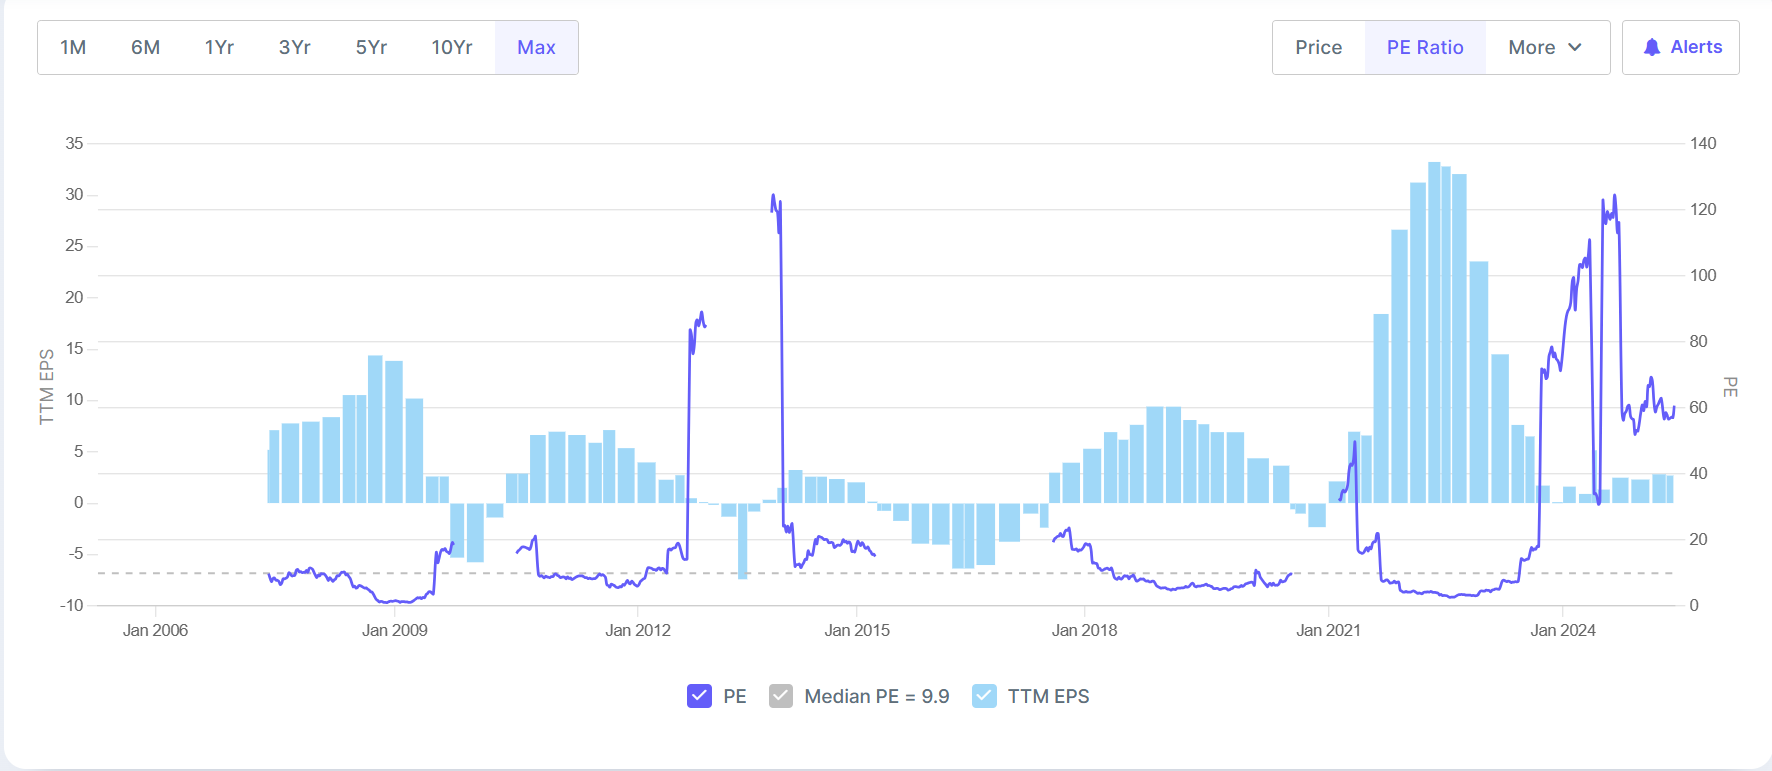
Can you see the crazy movements of P/E Ratio throughout the years? It feels like a roller coaster ride, even though it is a more than a century-old company. What we are seeing is a classic example of a cyclical business’s P/E Ratio trend. The places where the purple line is missing are the times when the company incurred losses.
Now look closely, whenever the Earnings Per Share (EPS) is rising, P/E is sinking and when EPS is low or negative P/E Ratio explodes. This happens a lot with steel companies as they are highly cyclical. Earnings rise fast when steel prices are high and fall when steel prices or global demand fall.
During peak times, when there is a surge in sales, EPS (denominator of P/E Ratio) rises, and that leads to a shrinkage in the P/E ratio, with the market price of the share remaining in the same range.
Conversely, during times of low sales or negative earnings, EPS falls, and that leads to a hike in the P/E ratio, with the market price of the share remaining in the same range.
One-Time Income or Expenses
Now, let us have a look at the Profit & Loss Statement of Aster DM Healthcare.
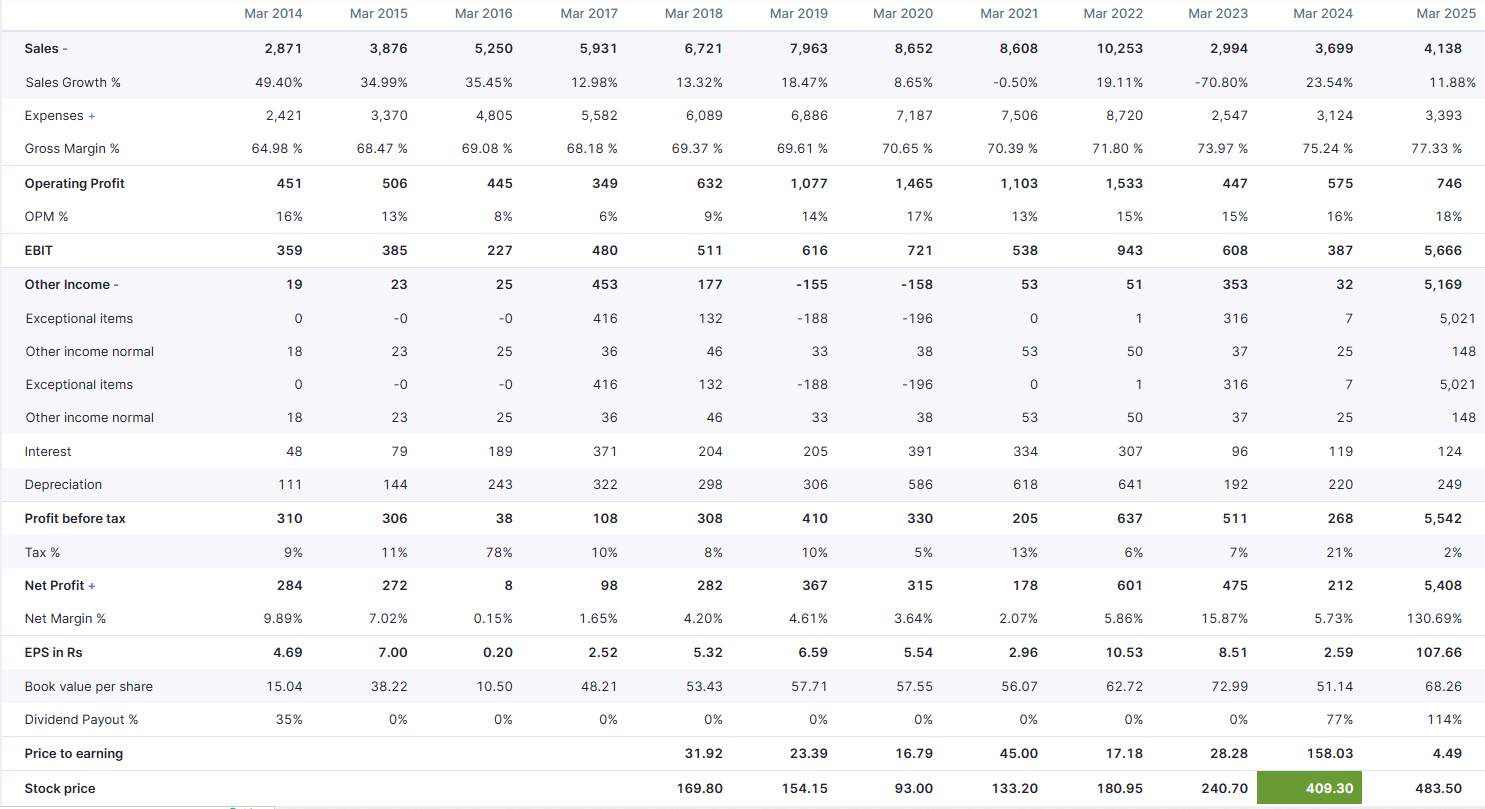
Have a look at the last column of March 2025. It shows the company has earned Net Profits of ₹5408 Cr, which is equal to 130.69% Net Margin % (vs ₹212 Cr, i.e. 5.73% Net Margin % in the previous year, March 2024).
Well, having such a huge growth in profits is supposed to be a good thing, right? Only if it is sustainable, and in this case, it is not. If you look at the same column, you will see that the sales growth has actually decreased compared to last year (March 2024 - 23.54% and March 2025 - 11.88%). Then from where did the extra income come from? If you observe carefully, you will see that in March 2025, Aster DM Healthcare has recorded a huge Exceptional Item under the heading Other Income of the amount ₹5021 Cr. Now compare the same amount with its previous year’s figure. It is just ₹7 Cr.
This exceptionally high Other Income has been earned through the sale of its businesses in the Gulf Cooperation Council (GCC) countries. Now, let us see how the P/E was affected. In March 2024, the Price to Earnings ratio was 158.03, and in March 2025, it came down to 4.49. This was due to the abnormal rise in the denominator (Earnings per share).
Similarly, if there is a company that has an amazing profitable business but suddenly has to book a one-time huge abnormal loss, like a massive penalty, or a huge Tax, it will push the earnings down, and that will lead to a hike in P/E Ratio. It is similar to what happened to Groww, which. Even though it had earned a total revenue of ₹3,145 Cr in FY24 (119% up from last year’s revenue), the company had to book a net loss of ₹805 Cr. It was due to the payment of a one-time tax of ₹1340 Cr for moving its registered office from the US to India.
CAPEX
Apart from other one-time income, there is another case when the P/E can look inflated. It is when companies are doing CAPEX. When companies heavily invest in setting up plants, machinery or other operating infrastructure, their costs do not show up in the P&L right away. Rather, they show up gradually over the years in the form of depreciation. So what happens?
Earnings will get suppressed in the initial time period of CAPEX due to high depreciation charges.
But the business might be getting stronger underneath.
Investors might see huge potential in the company and start buying the stock, thus pushing the stock price up.
Now the result is, prices are high, earnings are low due to high depreciation, and P/E is inflated.
Despite the high P/E, the company is not overpriced. It is rather in the investment phase and gearing up for the probable upcoming boom in earnings.
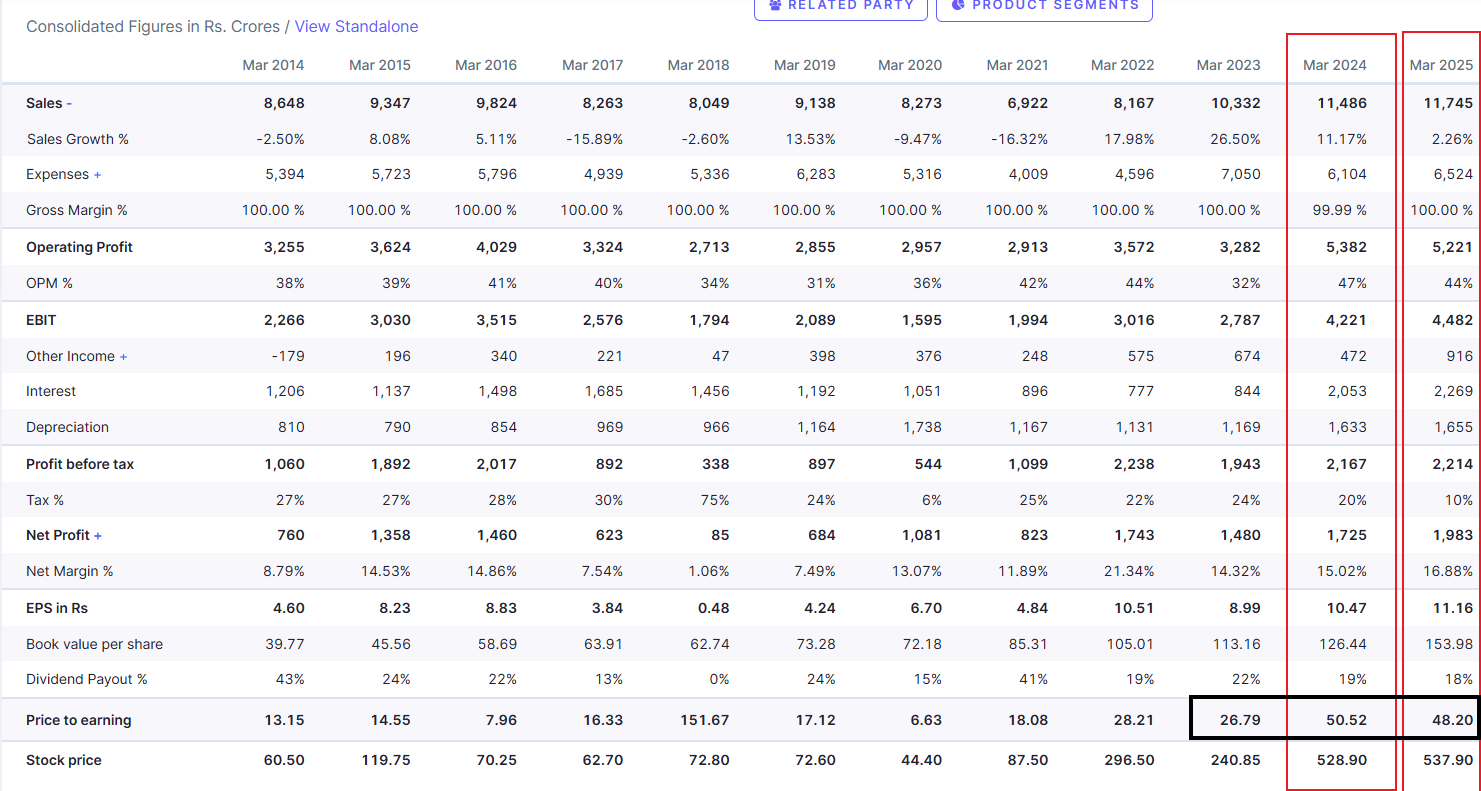
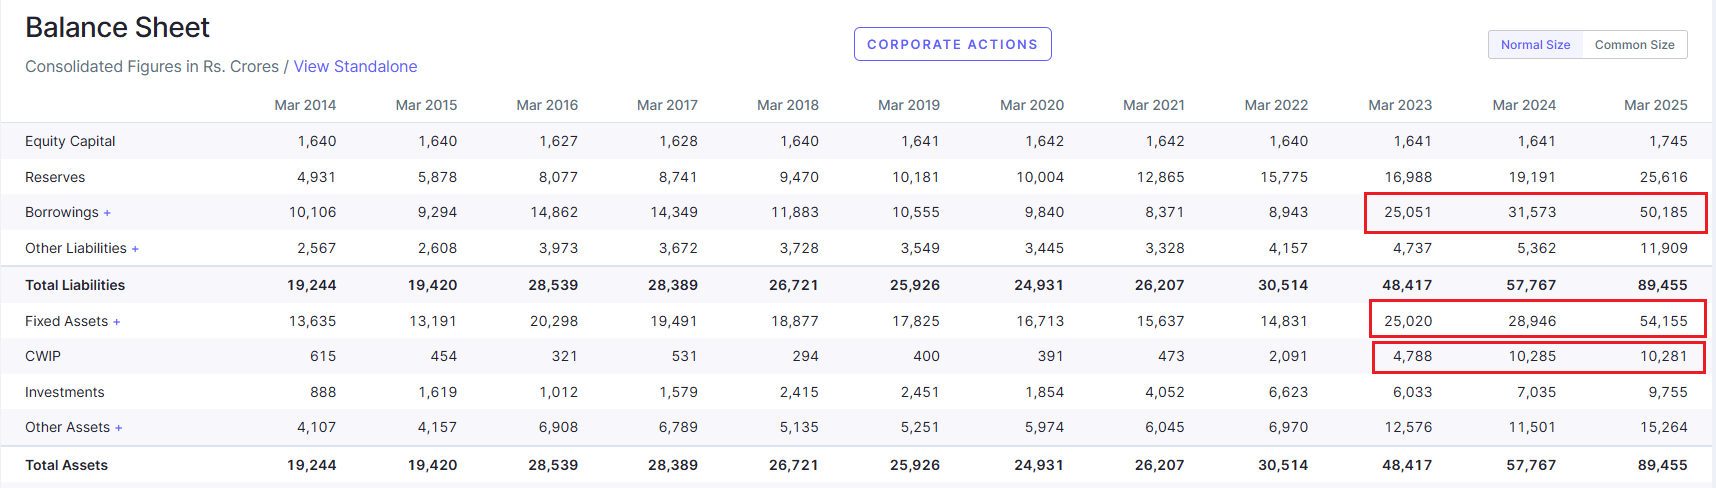
The first image is the Profit & Loss Statement of JSW Energy Ltd, and the second one is its Balance Sheet. The company has been increasing its Fixed Assets since March 2023, which has led to an increase in the depreciation too, from 11.31% in March 2023 to 14.22% in March 2024. Profit Before Tax has also been the same since March 2023, but people have awarded this share with a high price from March 2023 onwards.
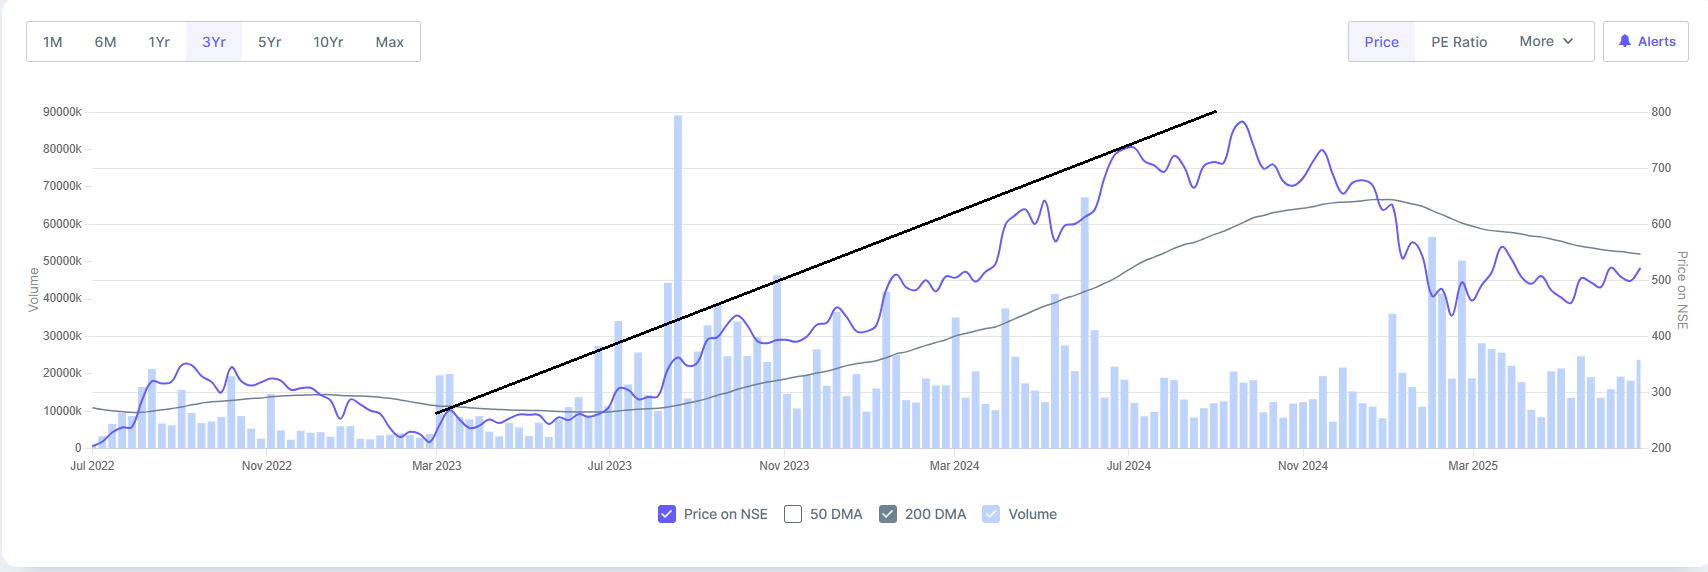
As a result, the Price to Earnings Ratio has increased to 50.52 in March 2024 from 26.79 in March 2023. It was due to a rise in stock prices and a fall in earnings. This fall in earnings is associated with the significant rise in Interest payables, depreciation and also due to a shrinkage in sales.
Conclusion
So, should we not use P/E Ratio at all?
That is not the case. P/E is not useless. Rather, it is context-sensitive and should be used with other ratios. It is popular due to its simplicity, but simple doesn’t mean smart, and a low P/E doesn’t equal its high value. Would you buy a house solely on the fact that you got it cheap? No, right? You would see its location, the building quality, or the water supply. At the least, you would enquire about the presence of any long waiting ghosts in the house :) So, why not ask a few more questions apart from P/E before buying a stock?
My Friend’s Story that I promised to share
The stock she bought was Vodafone Idea. In March 2016, the P/E was 27.57 (came down from 38.55 in March 2015), and the stock price was ₹63.40 (it came down from ₹104.09 in March 2015). To my friend, it looked cheap with a low P/E and a low price. Her logic was that it is just ₹63, how much lower can it go from here? Well, she found out! Definitely in a hard way, because from that day till now, after 10 long years, the stock still has not been able to reach that ₹63 mark (well it has touched that mark 1 or 2 times in a span of 2 years, but she missed those chances :) and is currently (as on 29th June 2025) trading at ₹7.38.

Described well with great insight 👍